# Analyzing APT 29 (NOBELIUM aka Cozy-Bear) – Part 2
## Welcome back, fellow analysts!
In my [last article](https://www.cybersleuthchronicles.com/landing/analyzing-apt-29-nobelium-aka-cozy-bear-part-1) my goal was to shed light on some of the details that I thought were missing from other technical blogs and reports on the internet regarding malware from APT 29. Additionally my goal was to share my observations of the techniques adopted by the threat actor.
In the first part of the series, we looked at how the threat actors obtained Initial access onto the victim's systems. We observed that they were trying to leave very minimal **IOCs** behind by removing any created registry entries after the registries loaded in memory for their next stage.
Moving forward, we are going to continue where we last left off and perform dynamic shellcode analysis. We will dump from memory the next stage of the malware infection chain (NativeZone.dll) and closely examine the dll, which will lead to the next stage of the attack.
## Dynamic shellcode analysis & dump NativeZone to disk
Shellcode is a simple code very carefully crafted by hand, usually written in assembly to be very minimal in size so that it can fit into a buffer. Since it's not a valid PE, a debugger such as x64dgb or Windbg can't just load it in memory. Shellcode lacks the necessary headers that tell the loader how to properly map the file from disk to memory. This is where the need for custom tools can wrap up the shellcode into a valid PE file, and set the PE entry point to be the start of where our shellcode comes in, another way for debugging shellcode is loading it into the memory of a host process and then transfer execution.
I decided to use a custom tool called [**sclauncher**](https://github.com/jstrosch/sclauncher)**.** This tool was recently created by the security researcher Dr. **Josh Stroschein**. A quick shout out to him. We are very thankful to have people like him in our community.
You can go to the GitHub repo, download sclauncher, and just give it a try. The way it works is it creates a host process for the shellcode and sets a breakpoint at the start of the shellcode so you can start your debugging from there.
Then you can fire up Windbg. Windbg is a very capable debugger allows you to attach to a running process, and debug an executable.
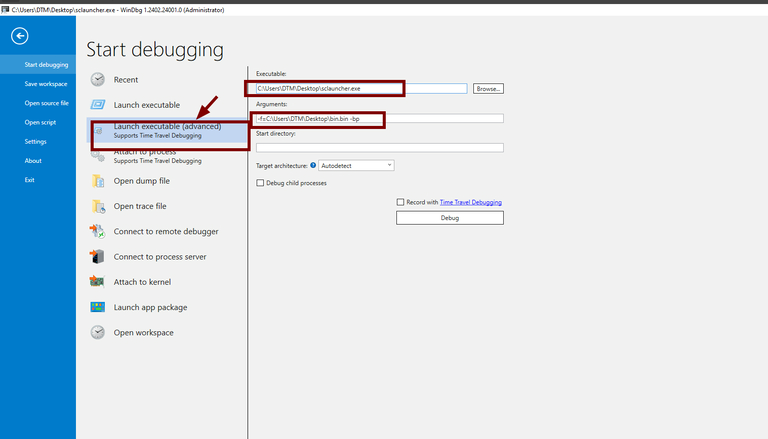
In our case we are going to open up **sclauncher** for debugging in Windbg, with the following options:
Copy
```
-f=bin.bin -bp
```
The **-f** option is for specifying the shellcode file to load, and the **-bp** is to break at the start of the shellcode.
I want to clarify that when using Windbg, it is important to specify the full path to the shellcode file we want to load. If you don't do this, your shellcode will not be able to load properly unless you have specified the starting directory to be the same as your shellcode file. I did not do that originally. Great lesson learned!
Now we can go ahead and start debugging!
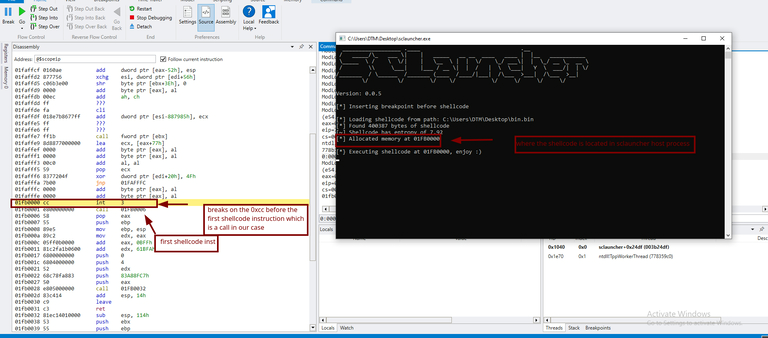
In the command window of Windbg, we can type in **g** for go to run till we hit our shellcode breakpoint, and then we can start from there.
Once we do this, it should hit the **0xCC** interrupt that was placed right before the first instruction of shellcode(that's the way sclauncher works).
Having made it this far, now the structure looks familiar from the previous post. The function at **01FB0032** is the main function of shellcode that we've statically looked at before.
Remember from the previous blog post that the first argument to the function at **01FB0032**, which in our case, is whatever is in **eax.** This is the base address of our DLL, and that the second argument is the hash value for the export function of interest. The third and fourth arguments seem to be an array of 4-byte key values and the size of the key, while the last one is just a flag. Now with that in mind, let's dump that DLL pointed to by **eax** from memory, save it to disk, and then go to that export and examine it further. The command for this is:
```
.writemem FileName Range
```
We need to give it the **full path** of where to dump the file and then the **address range** we want to dump.
To determine the starting address of the range, we can simply use the value stored in the **eax** register. However, determining the ending address can be a bit tricky since we don't know the exact size of the DLL. One way to do this is to scroll down until we reach the end of the DLL and use that address as the ending address.
## NativeZone analysis
Having dumped the DLL from memory to disk, let's go ahead and take a look at it in IDA.
Now that we know from the **shellcode analysis** that one of the exports is called NativeZone.dll. The question is which of the exports is it?
The NativeZone.dll is highly obfuscated in many ways that we'll get to that as we go through. One of these ways the code is obfuscated is through the presence of **junk|dead code**. There's tons of functions exported by the DLL, but only one of these is called, and most likely that's the one that's going to stage up for the next component of the malware.
After following the function call in Windbg to the entry point and comparing it to the other exports in our DLL, I discovered that the export being called was the "EqualService" function.
## Junk code
Junk code is a common anti-reversing technique used by malware to slow down the analysis process and make it a little more challenging.
As we navigate through the function, we come across numerous "junk function calls", irrelevant floating point operations, and code that seems purposeless and adds nothing to the malware's functionality. This code was intentionally inserted to divert the attention of analysts from recognizing or identifying the actual code.
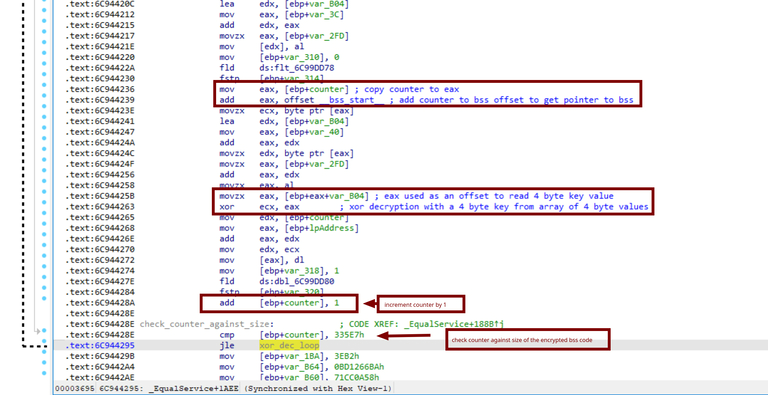
The picky eye will recognize that the actual code inside is just copying encrypted code blocks of fixed sizes from the **.rdata** section to the **.bss** section as demonstrated here.
This goes on until all encrypted code blocks are copied from the **".rdata"** section to **".bss"**.
Upon examining all write cross-references to the ".bss" section, we can see that there are 7 encrypted code blocks of varying sizes being copied in the same manner explained earlier.
The last reference to ".bss" is the setup for the xor decryption of the already copied encrypted code.
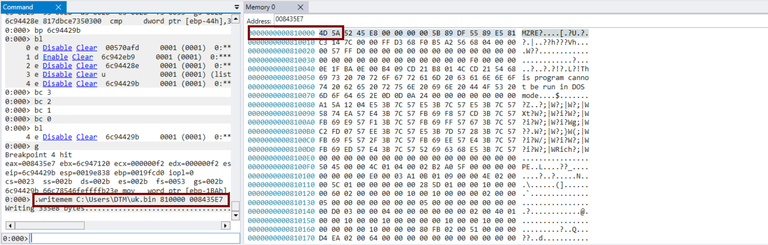
Since the key is read 4 bytes at a time from what appears to be an array of 4-byte XOR keys, I wasn't able to automate the process of decrypting the code, so I decided to go through the decryption process in Windbg and then dump the decrypted code from memory the same way we dumped the DLL.
### Final payload analysis
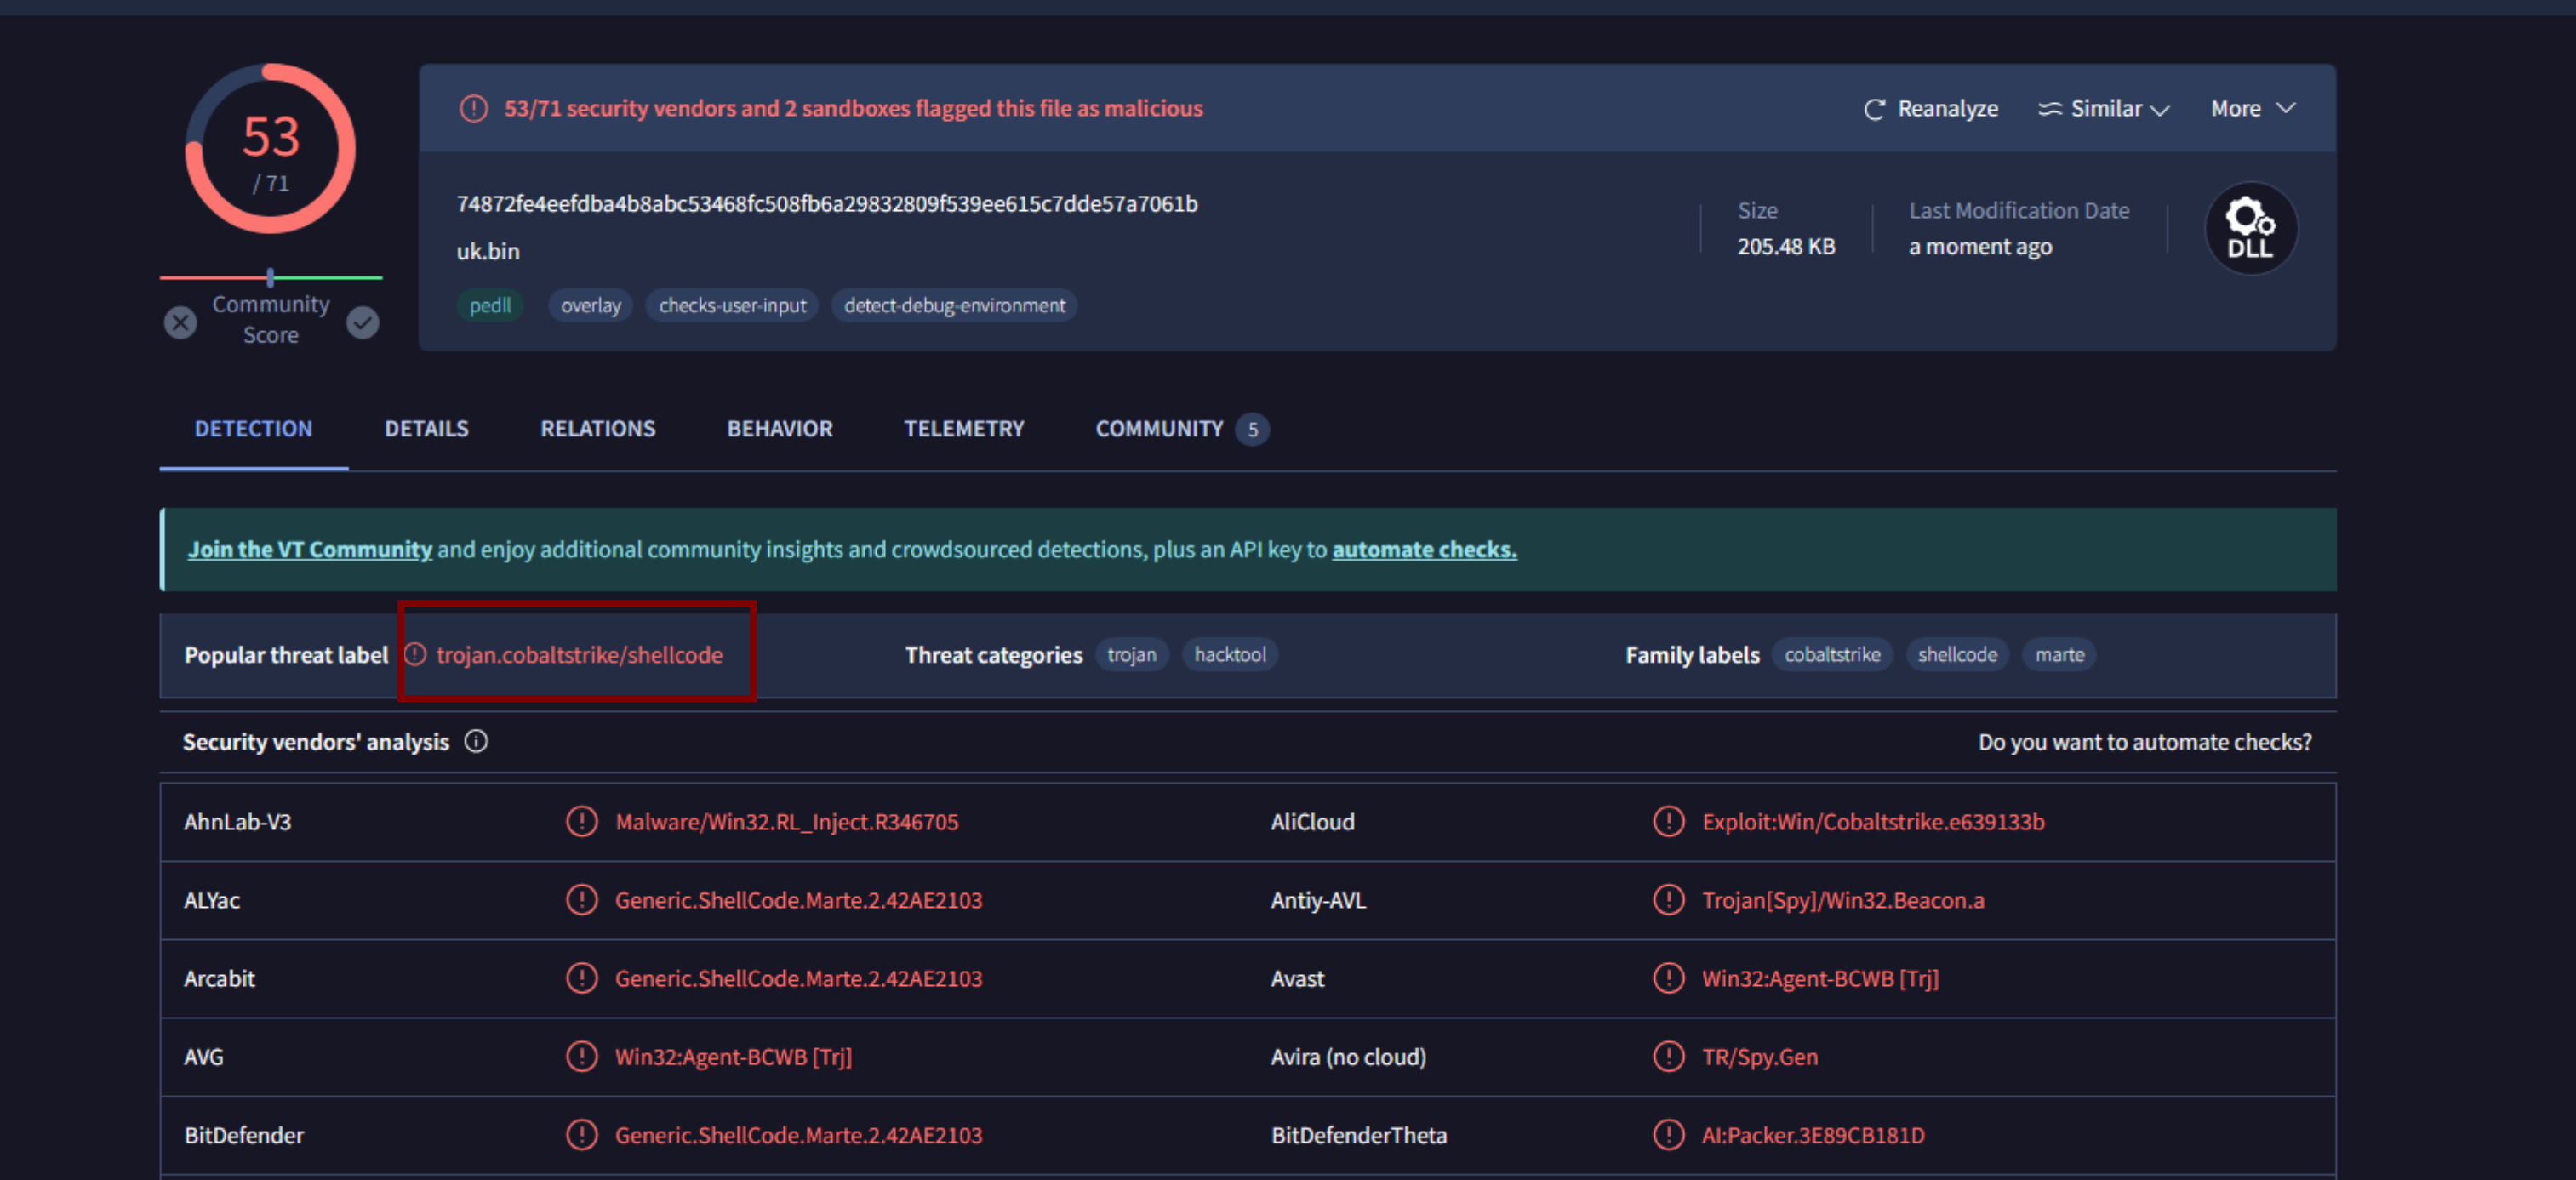
Once we've finally dumped the payload from memory, I submitted it to VirusTotal to get some opensource intel on the sample. It's got 53 out of 71 detections as a **CobaltStrike** beacon.
Now that we know what the final post-exploitation module is, and with a little bit of googling, i came across this amazing CobaltStrike parsing tool, which automates the process of extracting every bit of configuration information from the beacon, that tool was contributed by **SentinelLabs**, and you can find it the cobalt strike parser at [this link.](https://github.com/Sentinel-One/CobaltStrikeParser)
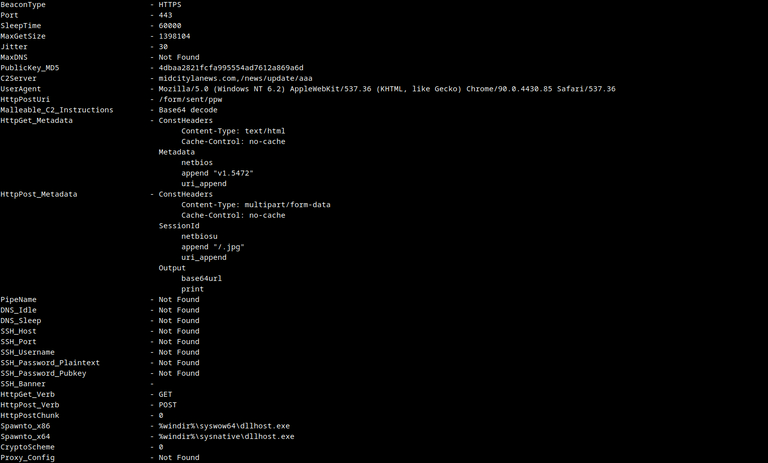
Running the **parse\_beacon\_config.py** script against our beacon we get:
We see it's an **HTTPS** beacon communicating with the C2 server **midcitylanews.com/news/update/aaa** over port **443**.

*This article was reprinted and modified with the approval of the author. The original article can be found at*[*https://blu3eye.gitbook.io/malware-insight/nobelium2*](https://blu3eye.gitbook.io/malware-insight/nobelium2)

## Mohamed Talaat Mahmoud Emam
My name is Mohamed Talaat and I go by code names DTM, and Blu3Eye on my socials. I am a Computer Engineer with a Bachelor in Computer Engineering from Suez Canal University,(Ismailia, Egypt). Even though I don't come from a strong cybersecurity background, I took it upon myself to build up a career in cybersecurity. I started as a Cyber Security generalist, I did a little bit of pen-testing and experienced using different tools such as Nmap, Metasploit, and Burb, after much thought I found myself a better fit in Blue Teaming and malware analysis. I do malware analysis and development of TTPs and I write detection rules as part of my on-daily-basis routine. You can find me on LinkedIn and my website is below.
Linkedin -
Website -